A platform to see where your strategy drifts, realign, and track every decision.
In production at since 2021.
1/5 of consulting price · 1/5 of consulting price (USD 22–55 K · 5 weeks) · Money back guarantee.

Solid · used every day
100% Swiss technology · EU data (OVH or client infra) · zero ex-filtration to public LLMs
Not a platform. Three answers to the three questions a CEO asks every month.
01
« Where does my strategy drift,
and by how much? »
The alignment report: declared priorities vs actual execution. 6 continuous drift indicators. The alert arrives before the invoice, not after.
↳ In production since 2021.
02
« What if I kill this project?
What if I double it? »
Numbered what-if simulation in 30 seconds. Budgets, milestones, focus. You walk into the executive committee with the answer, not the question.
↳ Executive committee: 90 min → 20 min.
03
« Who decided what,
when, why? »
Full event sourcing. Temporal replay: go back to any decision. Board-ready audit included, ESG/CSRD too.
↳ CSRD compliant, no setup.
« Qibud is the digital twin of the organization. Thanks to AI, we finally access weak signals, drifts, progress, misalignments — so that each can be proud of their work. »
— Gilles Ruffieux, co-founder & CEO
Classic tools
Qibud.AI
No migration. Qibud reads the signals and builds the map.
Priorities, projects, decisions, people. Invisible relationships become visible.
Decisions that stall, priorities losing focus. It reads facts, not declarations.
“Which projects are drifting this week?” Answer in seconds.
Architecture: native Knowledge Graph, event sourcing (immutable history), metadata rules engine, multi-agent AI layer with native MCP. Swiss sovereign stack, every alert traceable down to the source fact. No black box.
Regional hospital · 12 projects · 28 people · same prompt, same LLM. The difference: flat data, or structured in the Qibud graph.
Without graph · LLM on spreadsheet
Well structured. Time-boxed. Does not know the org.
With Qibud · LLM on graph
Sees what spreadsheets hide.
The graph context changes everything.
No modified data. No different prompt.
The graph context changes everything.
Synthetic, anonymized case. Dataset + protocol provided on request. Reproducible on your own LLM.
7 views. Click to zoom.
 Drift matrix · the heart of Qibud
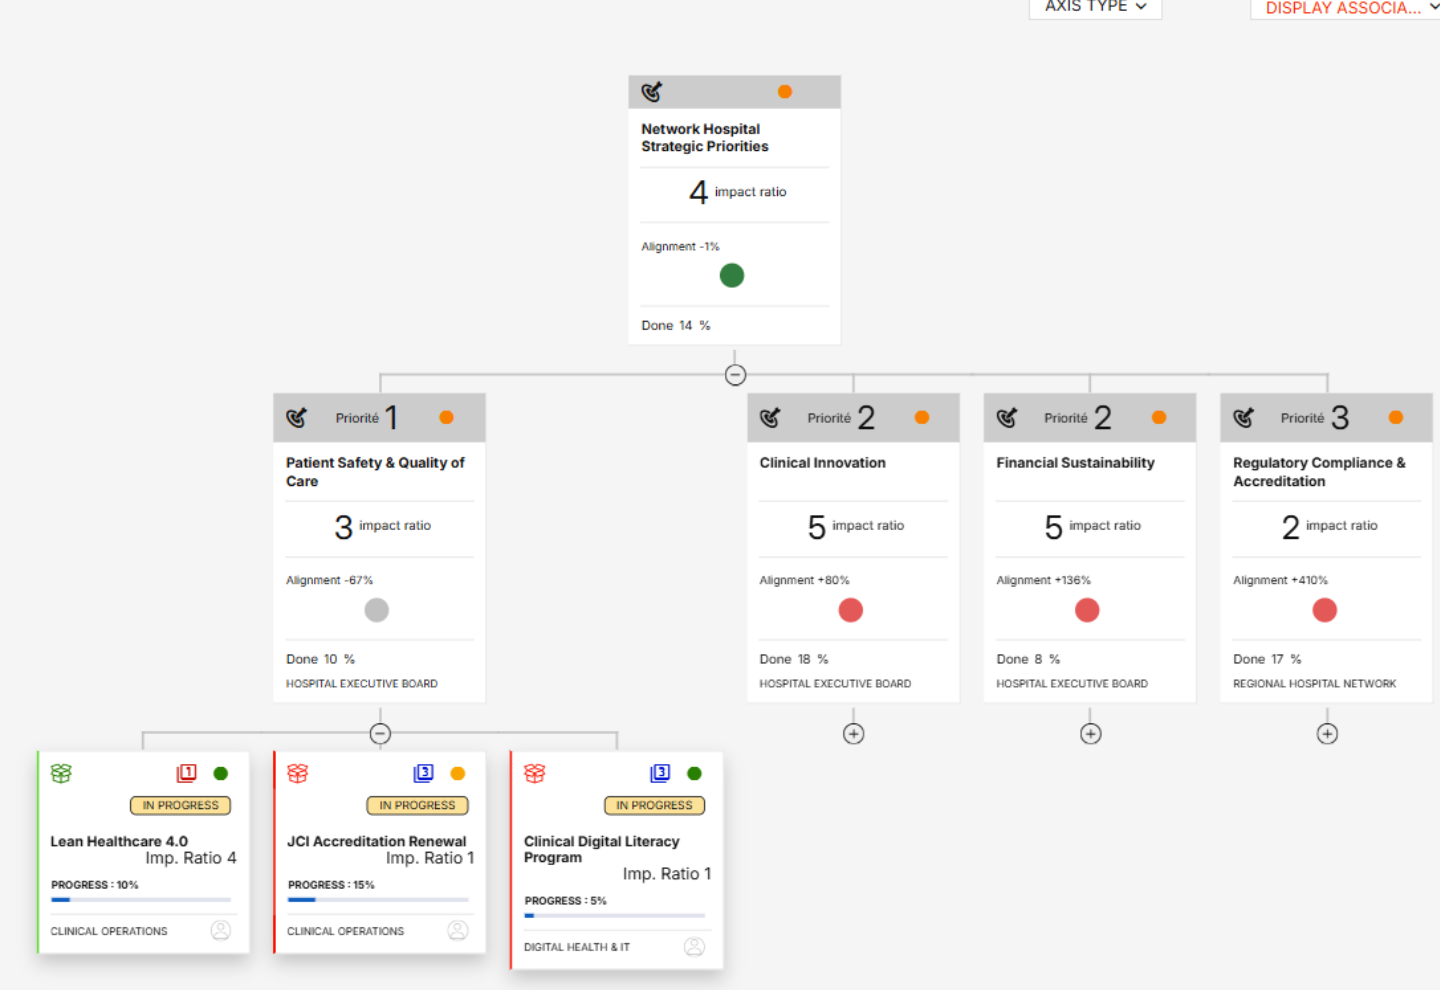 Hierarchical
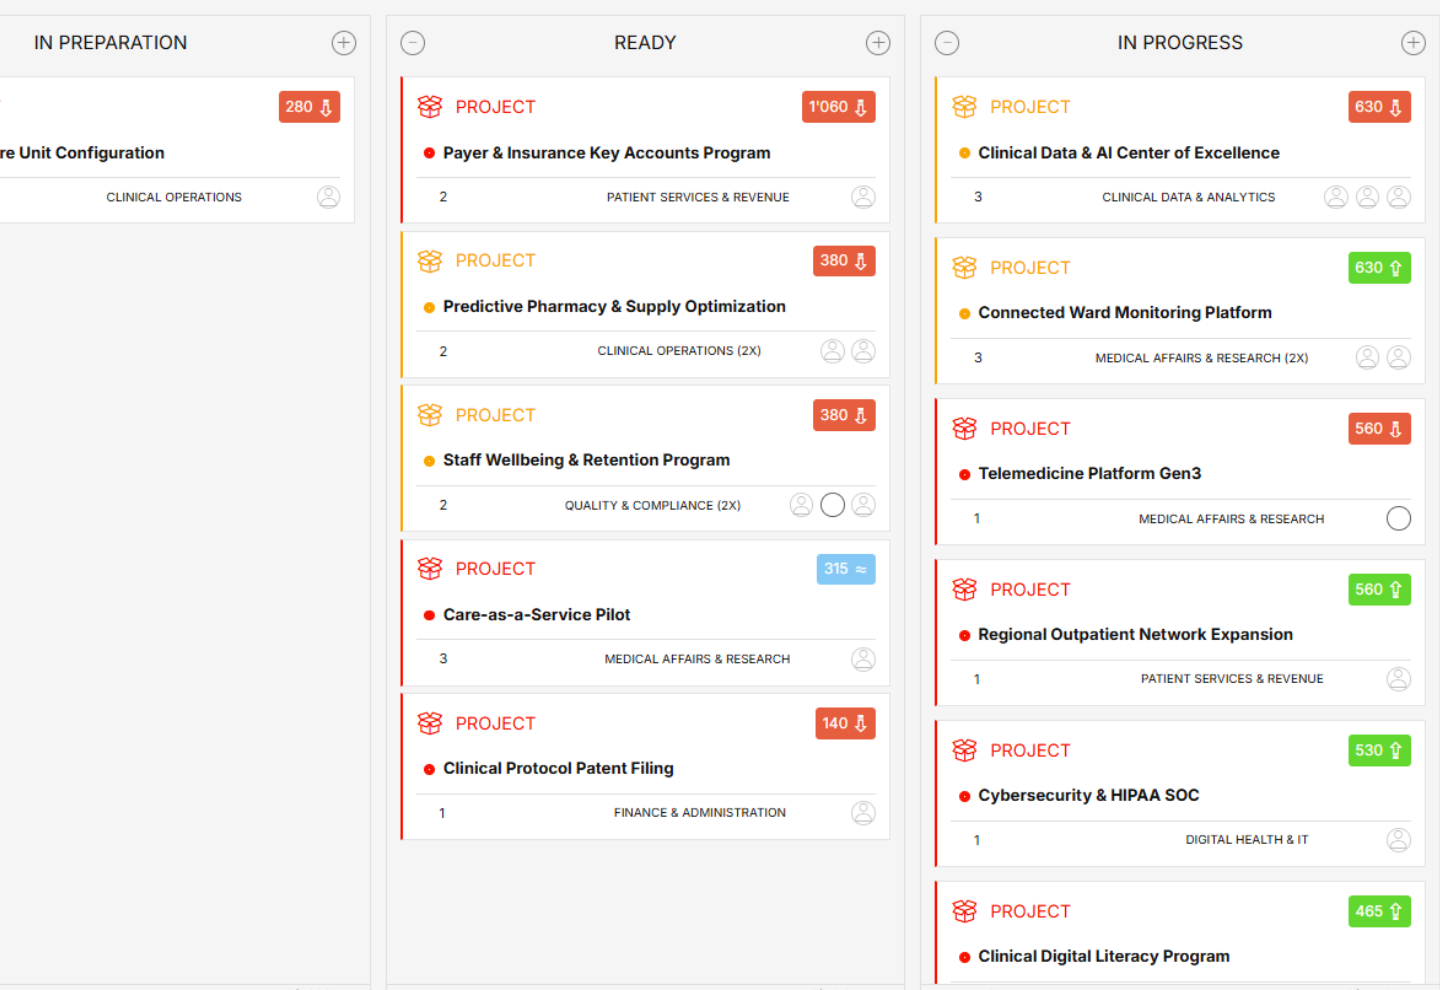 Kanban
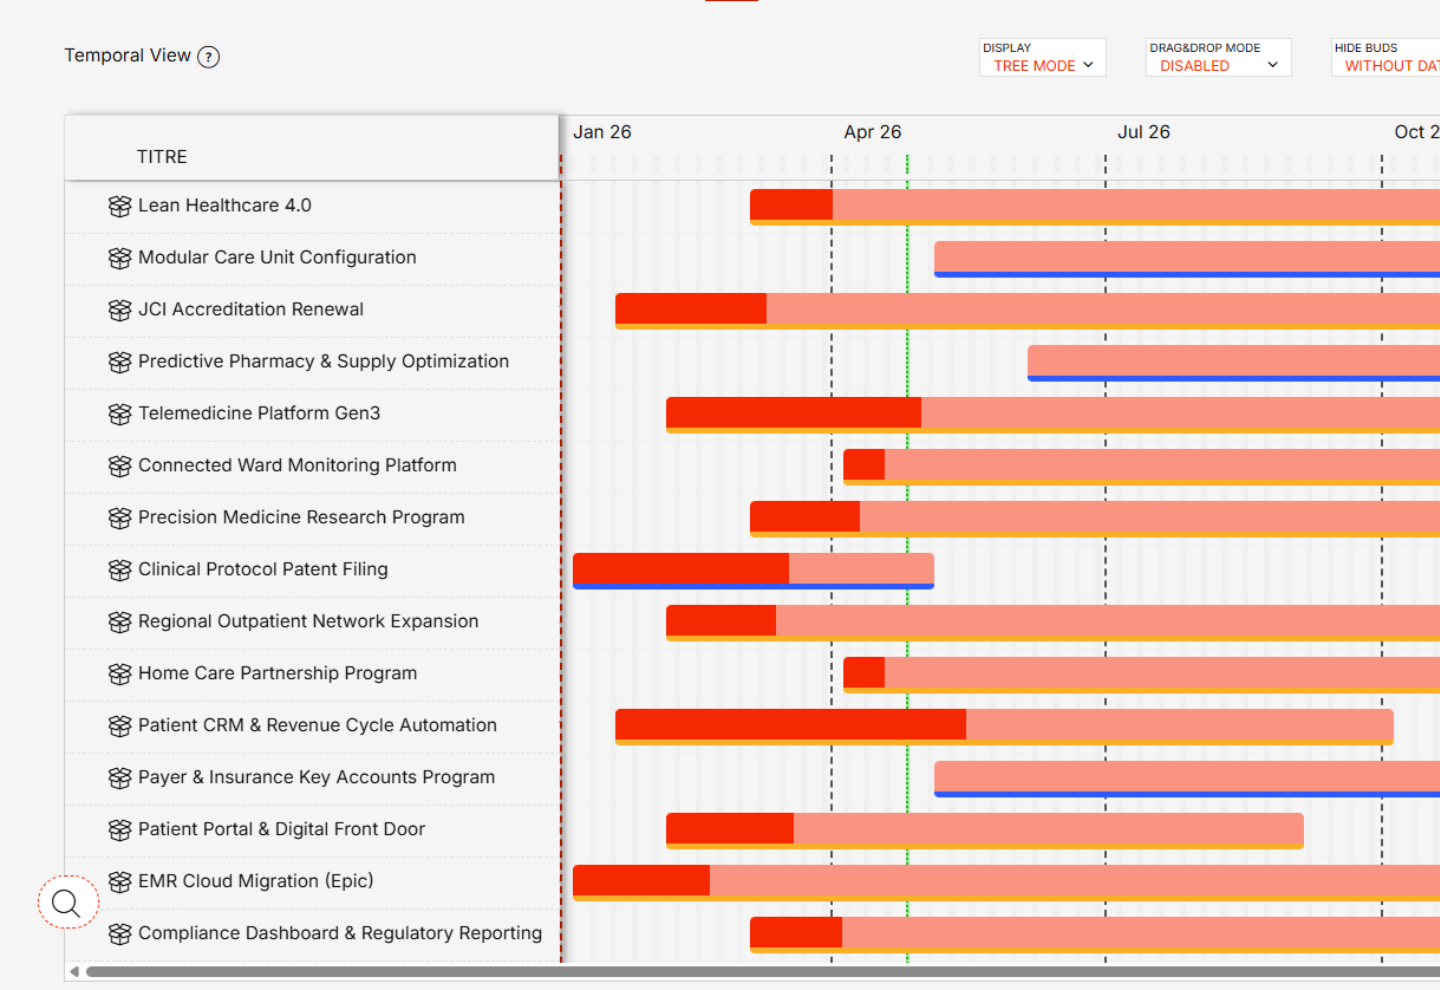 Timeline · Gantt
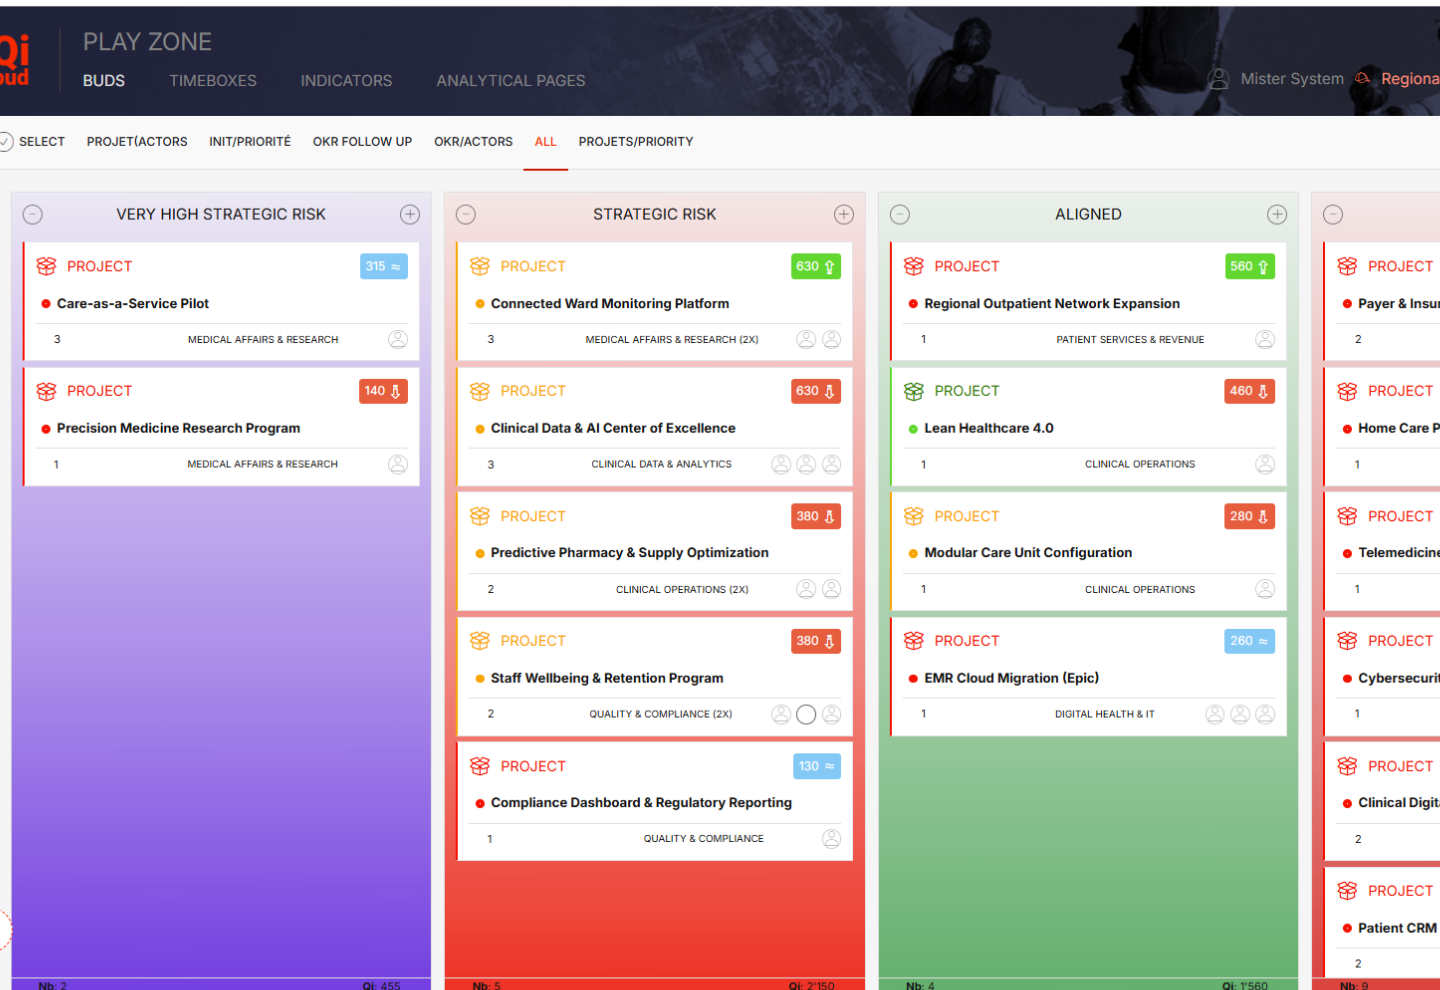
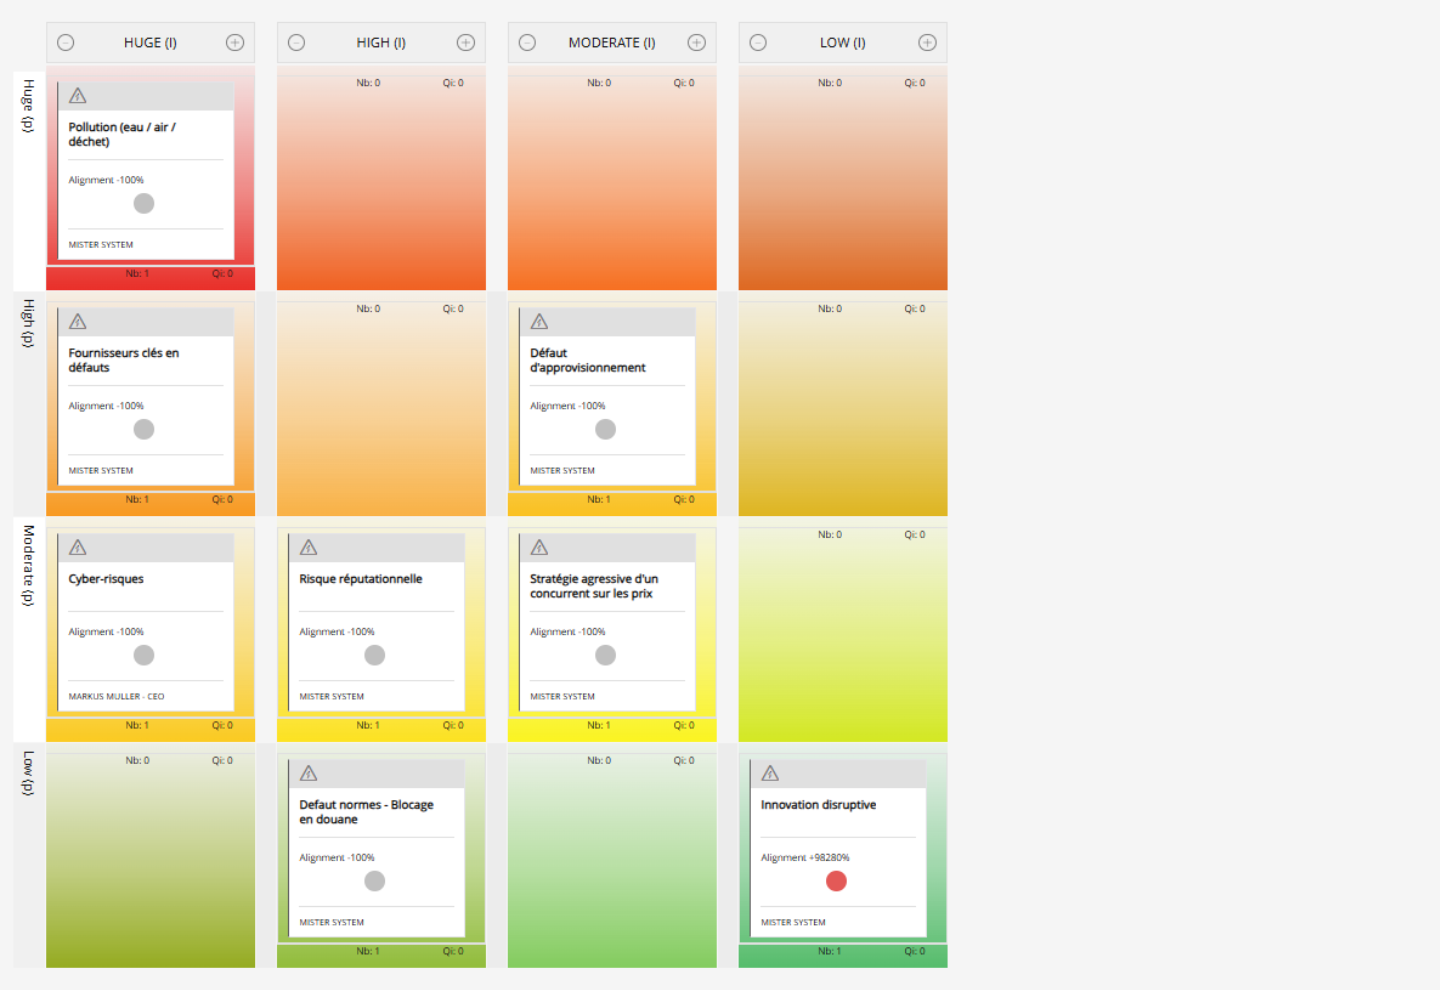 Risk matrix
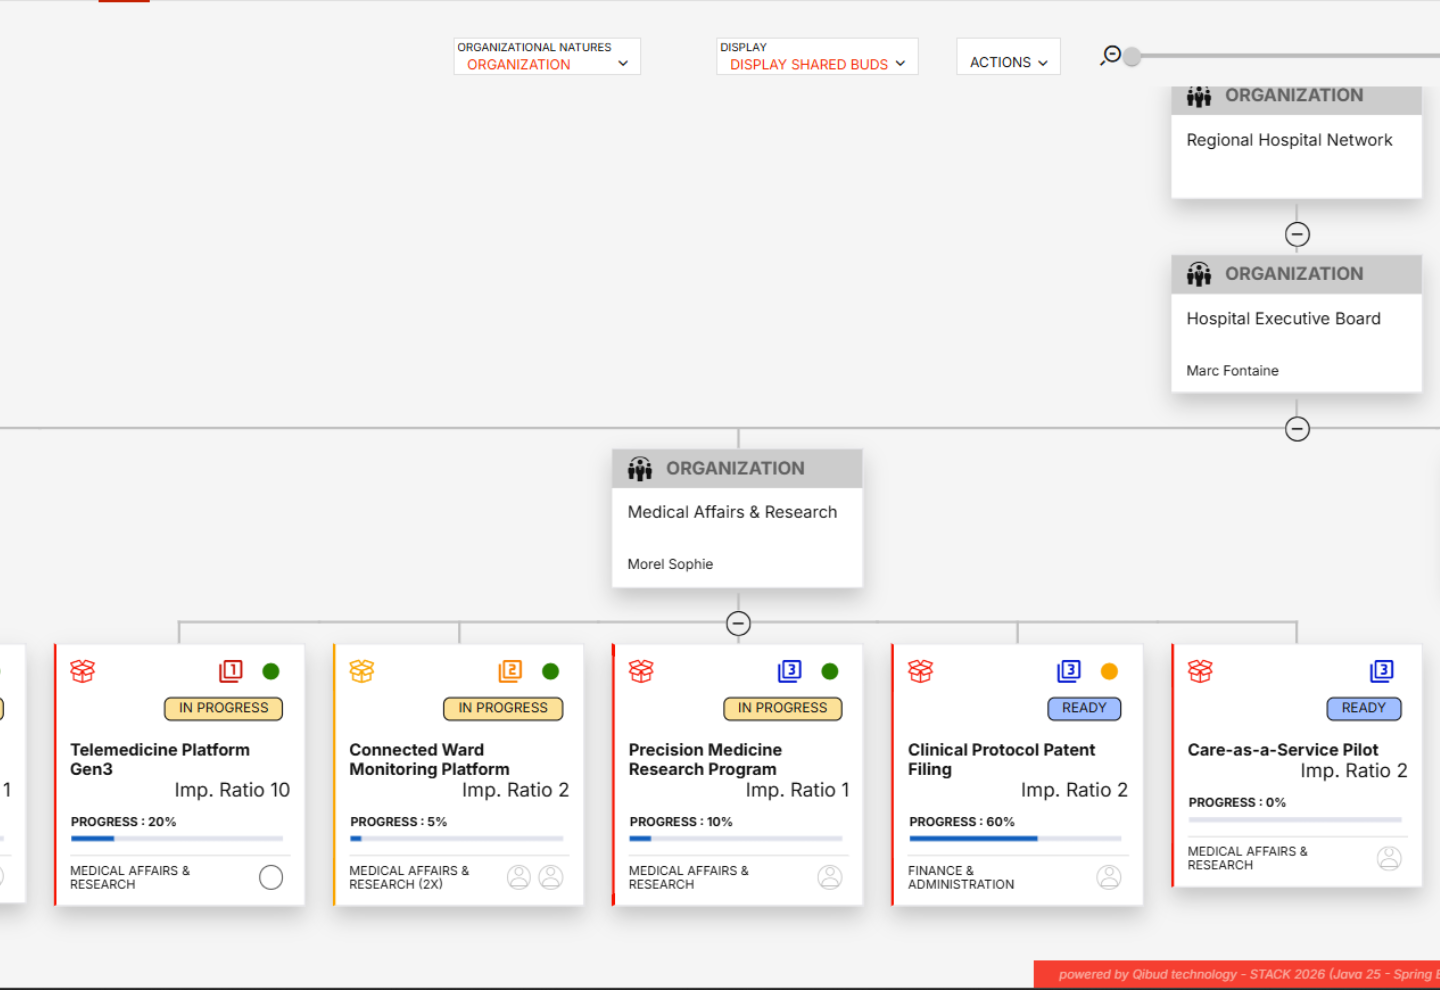 Org · projects
Drift matrix · the heart of Qibud
Hierarchical
Kanban
Timeline · Gantt
Risk matrix
Org · projects
Org · projects
Drift matrix · the heart of Qibud
Hierarchical
Kanban
Timeline · Gantt
Risk matrix
Org · projects
Scroll to see the 7 views · click to zoom.
The modules, the methodologies, the integrations.
If your IT, your PMO or your consulting firm wants the details — they're here.
Each capability serves a move. Not a feature in a vacuum. An answer.
Catch what drifts silently.
« What are we really aligning on? »
Your axes, your priorities, real focus. Continuous, not quarterly reporting.
« What's drifting silently? »
6 continuous drift indicators. The alert arrives before the invoice, not after.
« Where are my projects? »
Kanban, Gantt, dependencies. One single truth. No more PowerPoint at midnight.
Arbitrate by numbers, not opinion.
« What if I kill this project? »
Numbered simulation in 30 seconds. On budgets, milestones, focus.
« Are my POCs going anywhere? »
From idea to deployment. POCs measured by conversion rate.
« Is my CSRD reporting solid? »
Auditable double materiality. CSRD, VSME, … Board-ready.
Keep memory, prove the decision.
« Who decided what, when? »
Decision log. Temporal replay. Traceable audit, not rumor.
« Do we learn or repeat? »
Sprints, retros, capitalization. The org remembers its decisions, not just its failures.
« Why did project X slip? »
It knows. It answers. In English. No SQL, no dashboard to rebuild.
OKR, Agile (Scrum / Kanban), Classical (Waterfall / V), HERMES, Lean / Six Sigma, Lean Startup, Balanced Scorecard. Or your methodology, configured to fit.
JIRA bi-directional, SAP-ALM, MCP (Model Context Protocol for AI agents), Web Service (REST API), Excel (export), SSO (Azure AD · Okta · Google).
| vs. | Them | Qibud |
|---|---|---|
| ERP / SAP | Measure transactions, flows. | We measure activity tied to strategic execution, not transactions. |
| Asana / Notion / Jira | Manage to-do, tickets, projects. | We provide the strategic drift, not the to-do. |
| Power BI / Tableau | Aggregate raw data, build dashboards. | We interpret weak signals, not just data. |
| Celonis | Operational process mining. | We track strategic execution, not operational processes. |
A proprietary Knowledge Graph proven in production.
Infrastructure hosted EU/EEA · 5 years · zero critical downtime
« Qibud took away half the pebbles I had in my bag. »
CSR Executive
CSR Manager · international watchmaking group
Watch the master class · 5 years in production in demanding environments →
5 other recent master classes